What is prometheus
Prometheus is an open-source systems monitoring and alerting toolkit originally built at SoundCloud. Since its inception in 2012, many companies and organizations have adopted Prometheus, and the project has a very active developer and user community. It is now a standalone open source project and maintained independently of any company. Prometheus joined the Cloud Native Computing Foundation in 2016 as the second hosted project, after Kubernetes.
What is Grafana?
Grafana is open source visualization and analytics software. It allows you to query, visualize, alert on, and explore your metrics no matter where they are stored. In plain English, it provides you with tools to turn your time-series database (TSDB) data into beautiful graphs and visualizations.
What is helm
Helm is the best way to find, share, and use software built for Kubernetes.
We will use helm to install Prometheus & Grafana monitoring tools for this chapter.
# add prometheus Helm repo
helm repo add prometheus-community https://prometheus-community.github.io/helm-charts

# add grafana Helm repo
helm repo add grafana https://grafana.github.io/helm-charts
Deploy prometheus and grafana on K8S by helm
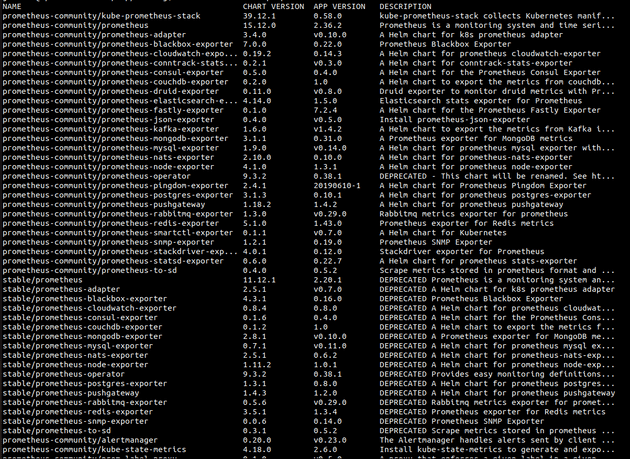
Search repo prometheus
helm search repo prometheusIn this chapter, we will using repo prometheus-community/kube-prometheus-stack version 39.12.1
Pull repo
helm pull prometheus-community/kube-prometheus-stack --version 39.12.1
tar -xvf kube-prometheus-stack-39.12.1.tgz
cp kube-prometheus-stack/values.yaml values-prometheus-grafana-stack.yaml
Config values-prometheus-grafana-stack.yaml
AlertManager
Ingress
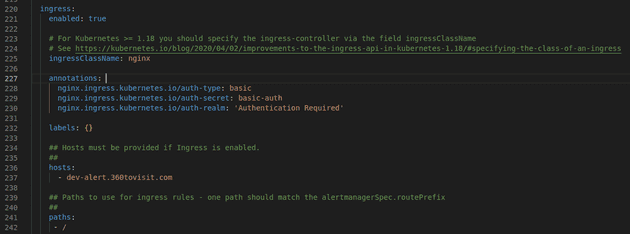
At line 221 - section ingress of alertmanager, we config as same as the screenshot below
- Don’t forget enable
ingressand sethosts
Persistent on eks
alertmanager:
    alertmanagerSpec:
        storage:
            volumeClaimTemplate:
                spec:
                storageClassName: gp2
                accessModes: ["ReadWriteOnce"]
                resources:
                    requests:
                    storage: 50Gi
Prometheus
Ingress
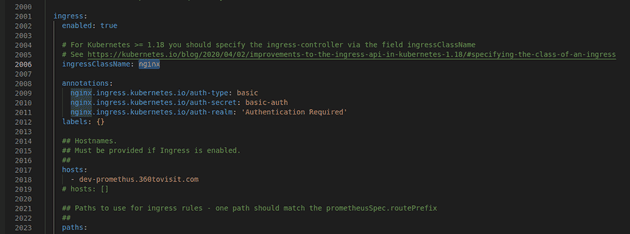
At line 1997 - section ingress of prometheus, we aslo config as same as the screenshot below
Persistent on eks
prometheus:
    prometheusSpec:
        storageSpec:
            volumeClaimTemplate:
                spec:
                storageClassName: gp2
                accessModes: ["ReadWriteOnce"]
                resources:
                    requests:
                    storage: 50Gi
Addtional Rules
With prometheus in this repo is provided a lot of rules in order to monitoring and alert. But we can add rules by config as follows
additionalPrometheusRules:
 - name: custom.rules
   groups:
     - name: 360tovisit
       rules:
       - record: my_record
         expr: sum by (cpu) (rate(node_cpu_seconds_total{node!='idle'}[1m])) > 6
- When the number of rules is large, the helm-value file will become very large, cumbersome and difficult to manage.
So we recommend using this way by create a new object as follows
apiVersion: monitoring.coreos.com/v1
kind: PrometheusRule
metadata:
  name: prometheus-grafana-kube-pr-test.rules
  namespace: prometheus
  labels:
    app: kube-prometheus-stack #This label matches the ruleSelector configuration so that it is automatically loaded into Prometheus
spec:
  groups:
  - name: test.rules #
This is the name shown in the PrometheusRule listing on K8S
    rules:
    - alert: Testing
#Rule name displayed on Prometheus' Rule section on Prometheus web
      annotations:
          description: Too many request
          summary: Too many request
      expr: |-
        sum by (cpu) (rate(node_cpu_seconds_total{node!='idle'})) > 6
#Comparison conditions to generate alarms
      for: 10m #Time to reach the pre-warning condition.
      labels:
        severity: warning
Then, we will apply it with command
kubectl apply -f AlertRule.yaml
We can get rules with command
kubectl -n prometheus get PrometheusRuleWe must config ruleSelector in order to rules is automatically loaded into Prometheus
prometheus:
    prometheusSpec:
        ruleSelector:
            matchExpressions:
                - key: app
                operator: In
                values:
                    - kube-prometheus-stack
Grafana
Ingress
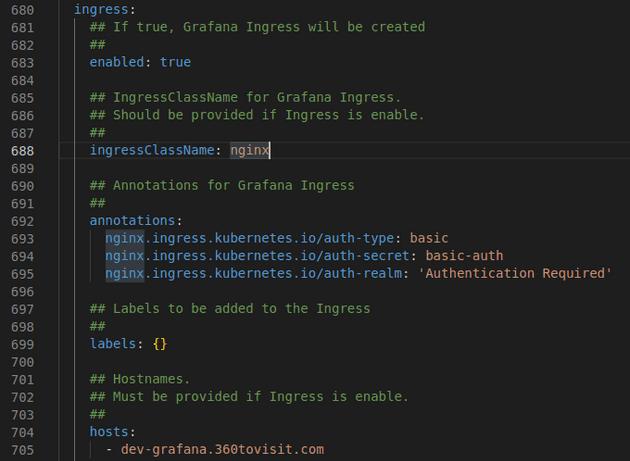
At line 677 - section ingress of grafana, we also config as same as the screenshot below
AdminPassword
At line 670 - adminPassword, change it
Persistent on eks
Because Grafana is not persistent, we could find solution to resolve this issue at here
grafana:
    persistence:
        type: pvc
        enabled: true
        storageClassName: gp2
        accessModes:
        - ReadWriteOnce
        size: 50Gi
        finalizers:
        - kubernetes.io/pvc-protection
Notification
To recive notification, we config as follows
  config:
    global:
      resolve_timeout: 5m
    route:
      group_by: ['namespace', 'job']
      group_wait: 30s
      group_interval: 5m
      repeat_interval: 12h
      receiver: 'telegram'
      routes:
      - receiver: 'telegram'
        group_wait: 10s
        matchers:
        -  namespace="prometheus"
    receivers:
    - name: 'telegram'
      telegram_configs:
      - send_resolved: 'true'
        bot_token: '5835412393:AAH2piHBLa9-27yIagIxffDS9GuIRCabAhI'
        chat_id: '-1001641231215'
        api_url: 'https://api.telegram.org'
        parse_mode: 'MarkdownV2'
    templates:
    - '/etc/alertmanager/config/*.tmpl'
Deploy
kubectl create ns prometheus-grafana-stack

helm install prometheus-grafana-stack \
    -f values-prometheus-grafana-stack.yaml kube-prometheus-stack \
    -n prometheus-grafana-stack \
    --set persistence.storageClassName="gp2" \
    --set persistence.enabled=true
Release
helm upgrade prometheus-grafana-stack \
    -f values-prometheus-grafana-stack.yaml kube-prometheus-stack \
    -n prometheus-grafana-stack \
    --set persistence.storageClassName="gp2" \
    --set persistence.enabled=true
Remove
helm uninstall prometheus-grafana-stack \
    -n prometheus-grafana-stack
kubectl delete ns prometheus-grafana-stack
Monitoring
Import dashboard
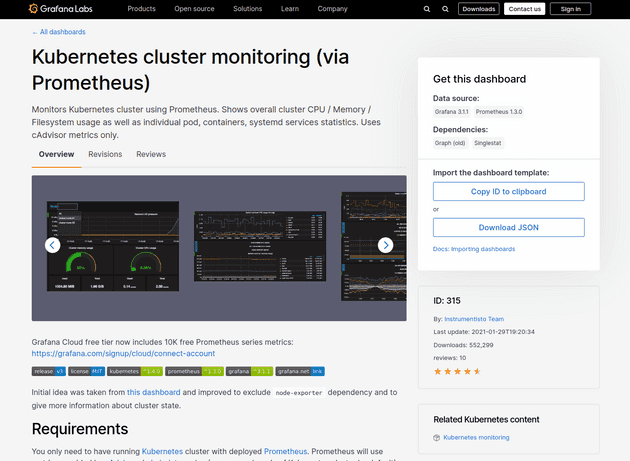
We will search on google with keyword grafana k8s node dashboard, after review a lot of recommend, we choose a dashboard and click Copy ID to clipboard
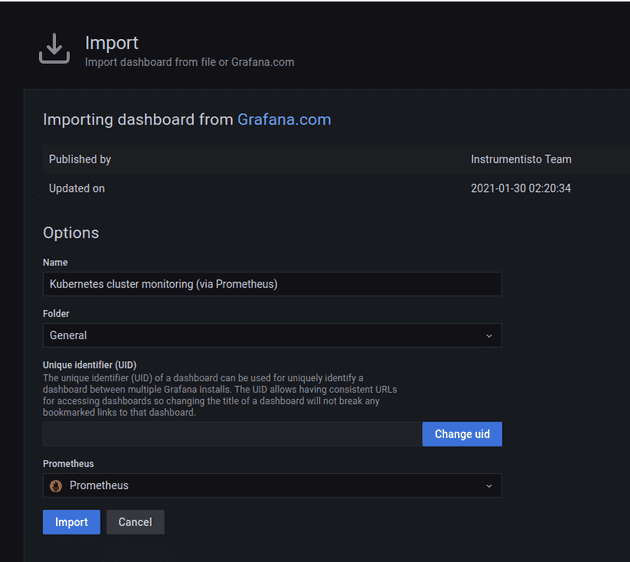
Now, back to grafana:
- Click
'+'button on left panel and select ‘Import’. - Enter
IDdashboard id under Grafana.com Dashboard. - Click
‘Load’. - Select
‘Prometheus’as the endpoint under prometheus data sources drop down. - Click
‘Import’.
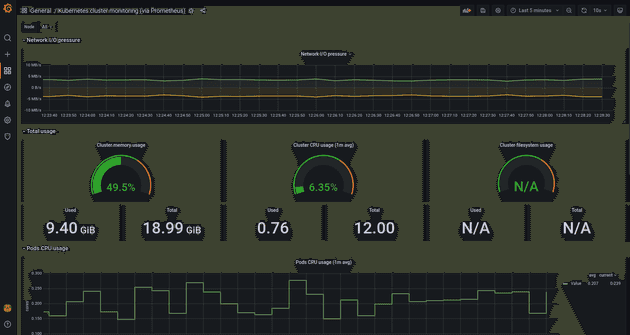
The result after import dashboard
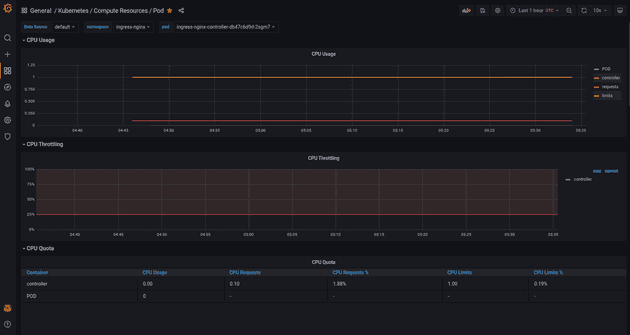
Monitoring all pods
In this repo prometheus-community/kube-prometheus-stack is included dashboard monitor all pods, so we access index page and then choose kubernetes-compute-resources-pod dashboard on list. After access that dashboard, we choose Data source, namespace and pod, it will show consume of pod
